Syntrix Horizon elevates your monitoring experience from flat dashboards into a fully interactive 3D world. Every host, every group, every problem becomes a spatial object you can explore, rotate, zoom into, and understand instantly. Instead of deciphering endless tables or scanning static graphs, you navigate a living environment where severity, availability, and topology are visually encoded.
This isn’t “another Zabbix frontend.” It’s a visualization engine that turns your infrastructure into a dynamic landscape. Hosts scale based on item count, pulse when problems arise, and cluster intelligently based on your chosen layout. Group hubs reveal structure at a glance, and custom wires let you map relationships your monitoring system doesn’t natively expose.
Horizon gives you a new mental model — one where complexity becomes intuitive, and where your environment finally looks like the system you manage.
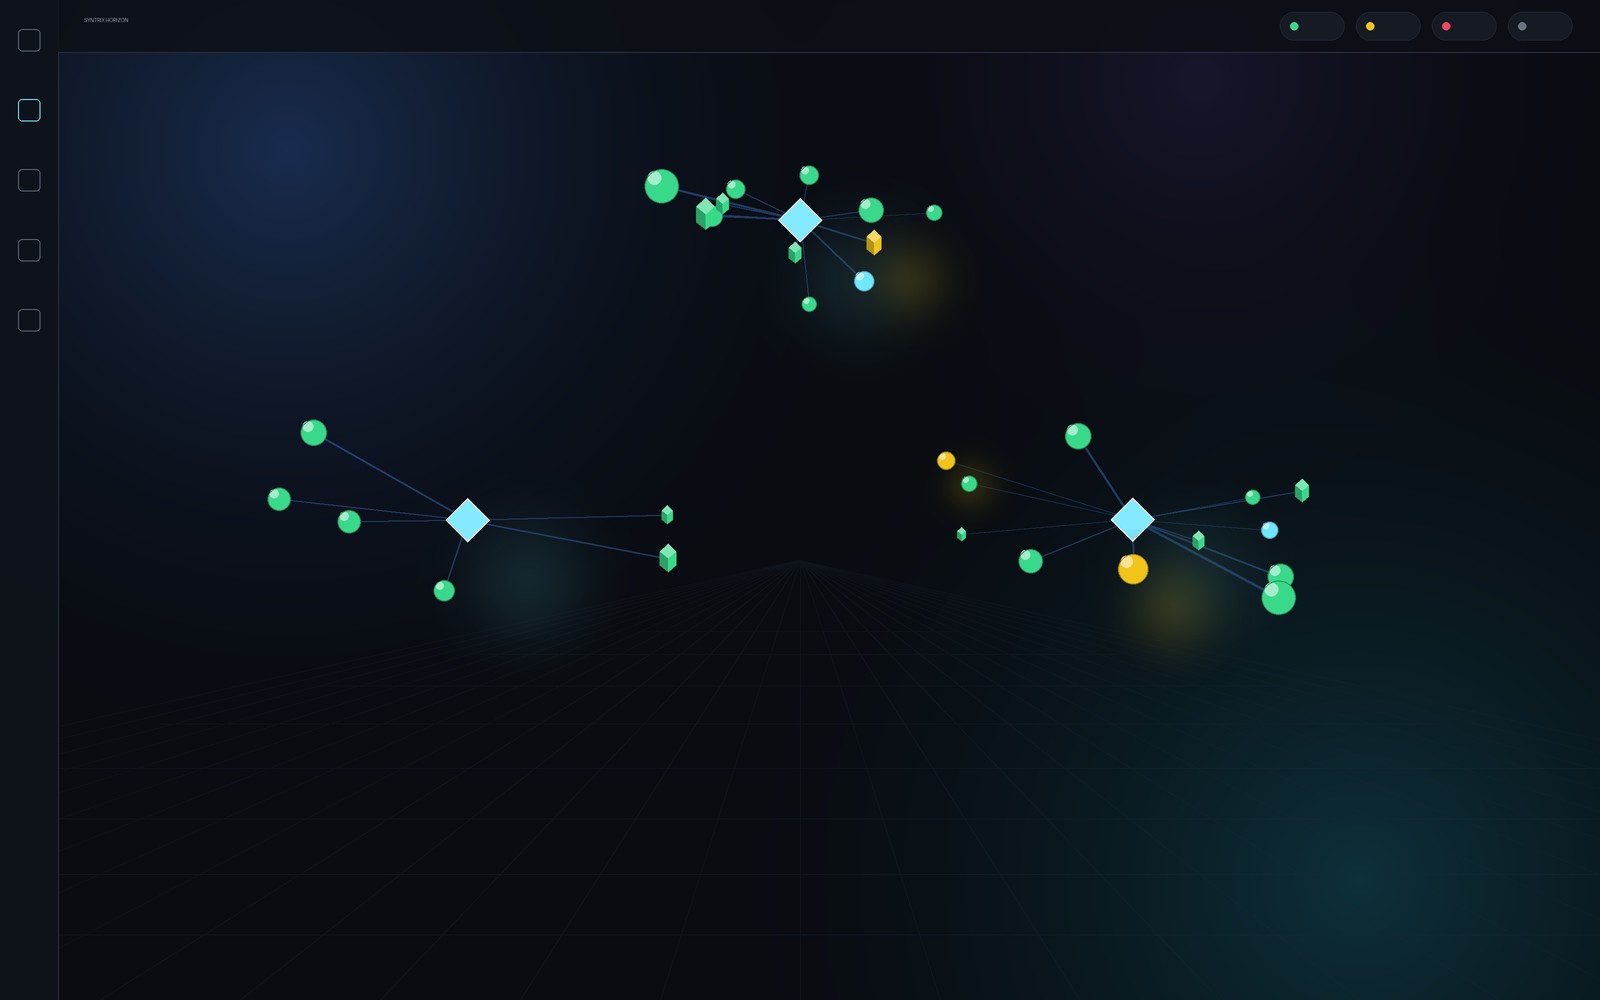
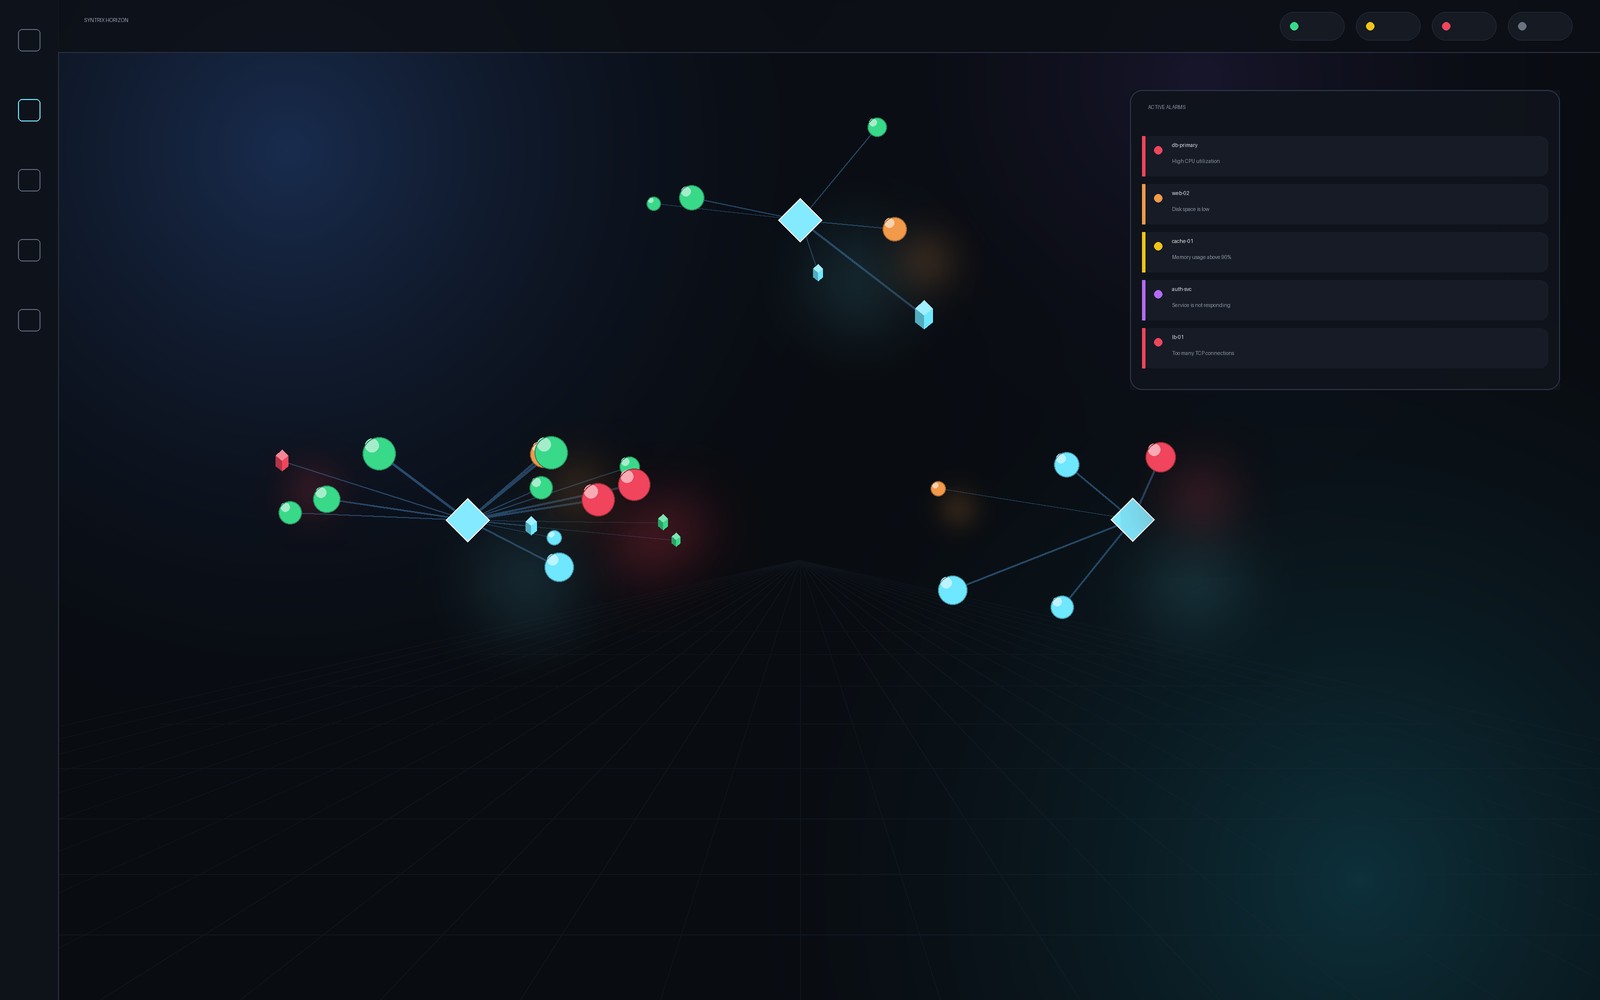
Horizon turns raw Zabbix data into visual signals your brain processes immediately.
Colors shift based on severity. Halos pulse around troubled hosts. Down systems fade into grey. Group hubs illuminate their members. Focus mode isolates what matters.
The global Alarms surface consolidates every active problem across your loaded hosts, filterable by severity, with inline acknowledge — giving you a command‑center view of your environment’s health. And because Horizon cross‑checks triggers against their current values, you never get stuck with stale “ghost problems” that Zabbix forgot to auto‑close.
This is monitoring you feel — not just read.
Monitoring shouldn’t feel like reading a database. Syntrix Horizon gives your infrastructure a visual identity — one that’s expressive, intuitive, and powerful.
Drag, snap, nudge, label, add floors/walls, and draw wires to build layouts that match your real topology.
Save full 3D scenes and share them with specific Zabbix users or groups. Private by default, collaborative when you choose.
Click any host to view metrics, logs, problems, tags, and maintenance state in a clean, tabbed panel.
A command‑center view of all active problems across loaded hosts, with severity filters and inline acknowledge.
Rearranging a live layout, and a host's full dashboard — exactly what your team sees day to day.
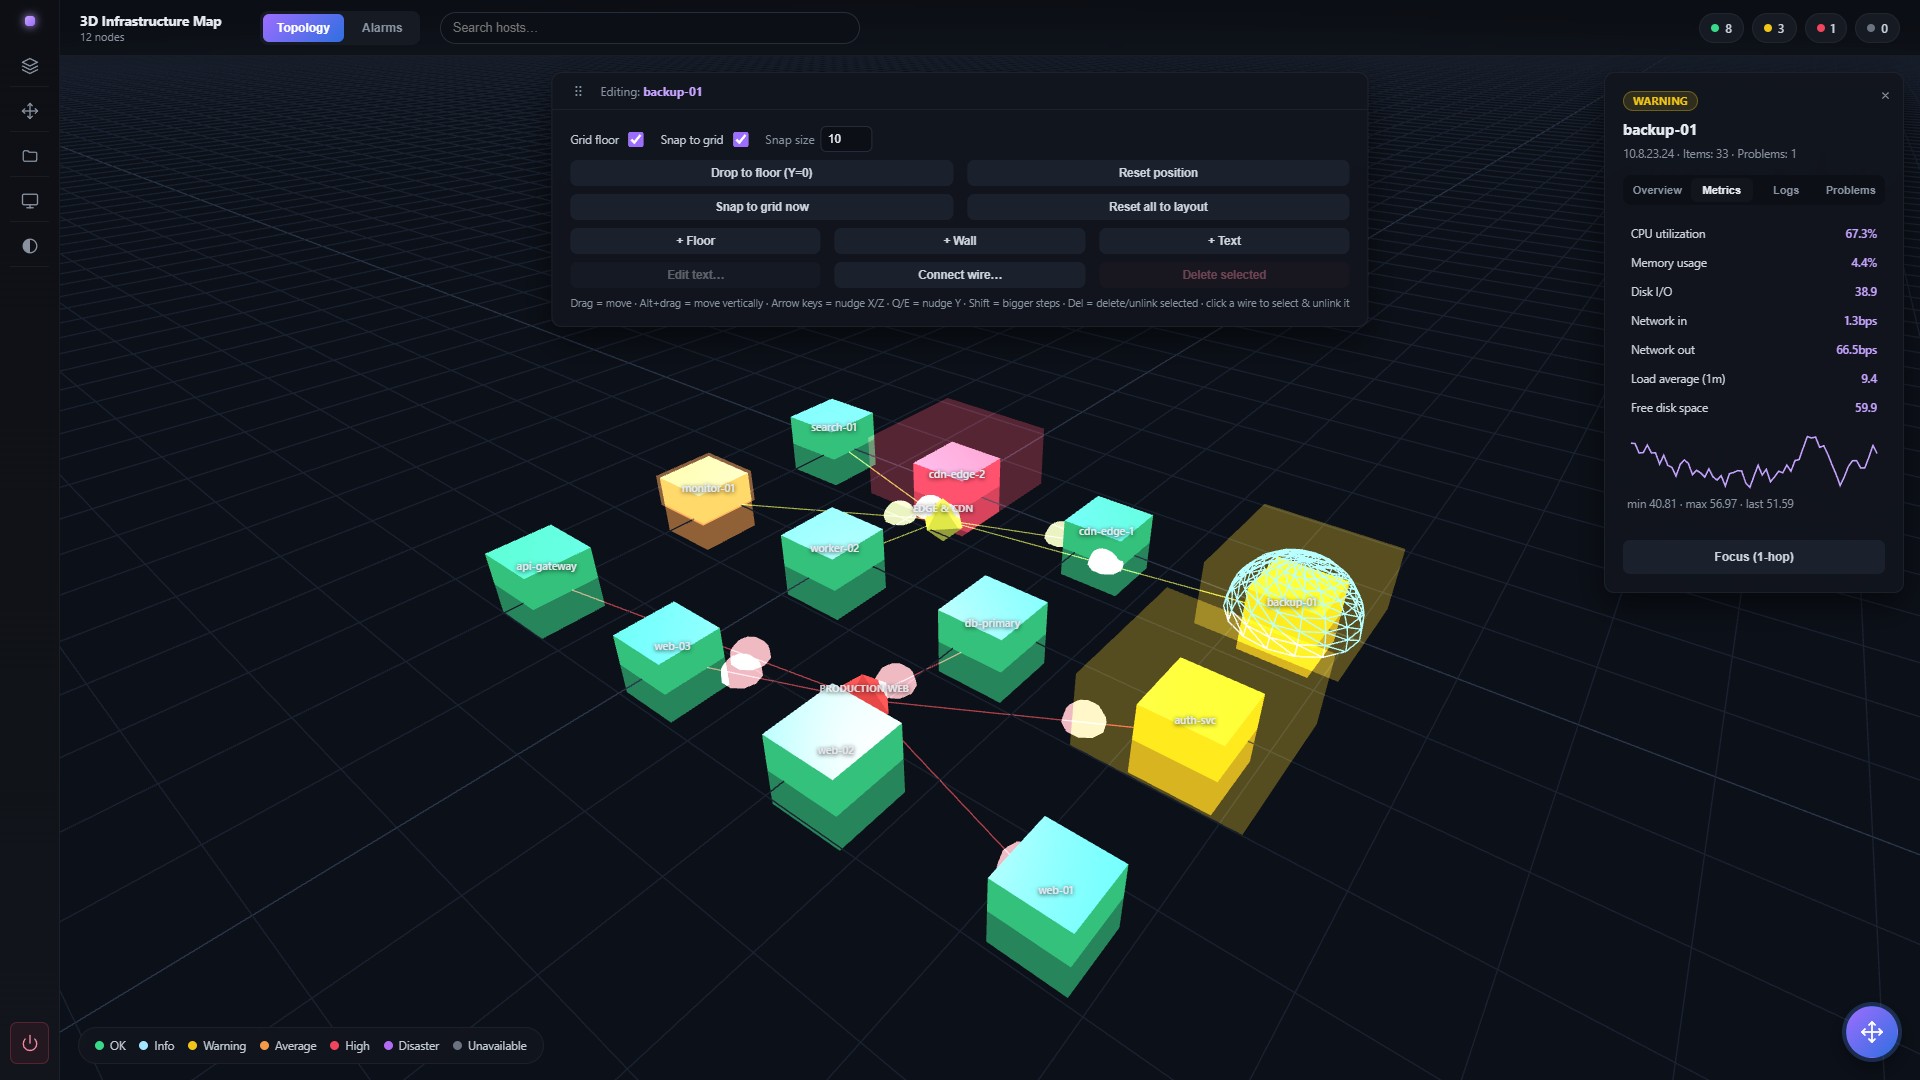
Drag, snap, and nudge hosts onto a grid floor that matches your real topology — then save the layout as a panel.
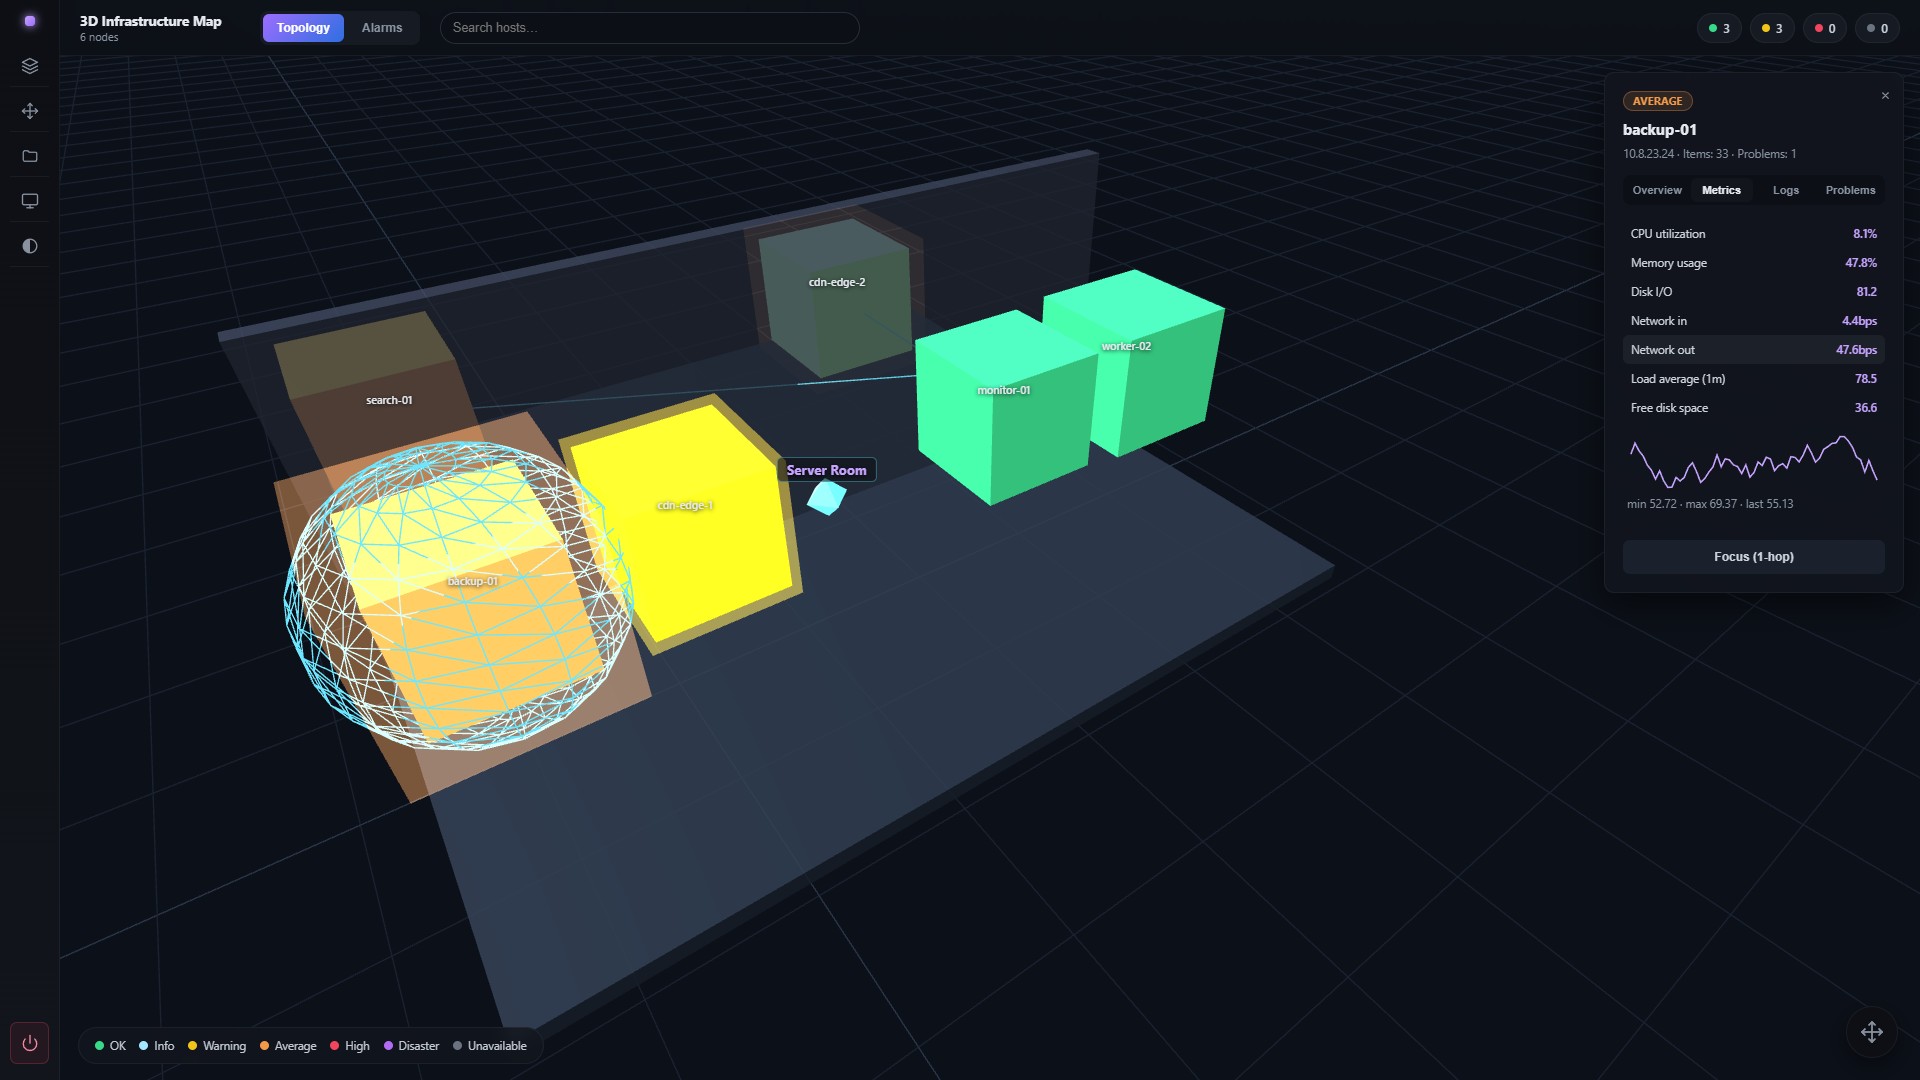
You can easily create 3D spaces for your hosts and share them as panels with other users
