NETWATCH is a lightweight, public‑facing network status dashboard that connects to your Zabbix instance and displays host availability in a clean, minimal UI. It provides a read‑only status page for visitors and a secure admin panel where you can configure Zabbix API access, choose host groups, set refresh intervals, and customize the look — all without touching the code.
Built for simplicity and safety, NETWATCH keeps your Zabbix token server‑side, encrypts credentials, rate‑limits logins, and serves a cached snapshot so your status page stays responsive even during outages. It’s a drop‑in, self‑hosted status page designed for teams who want clarity, security, and zero bloat.
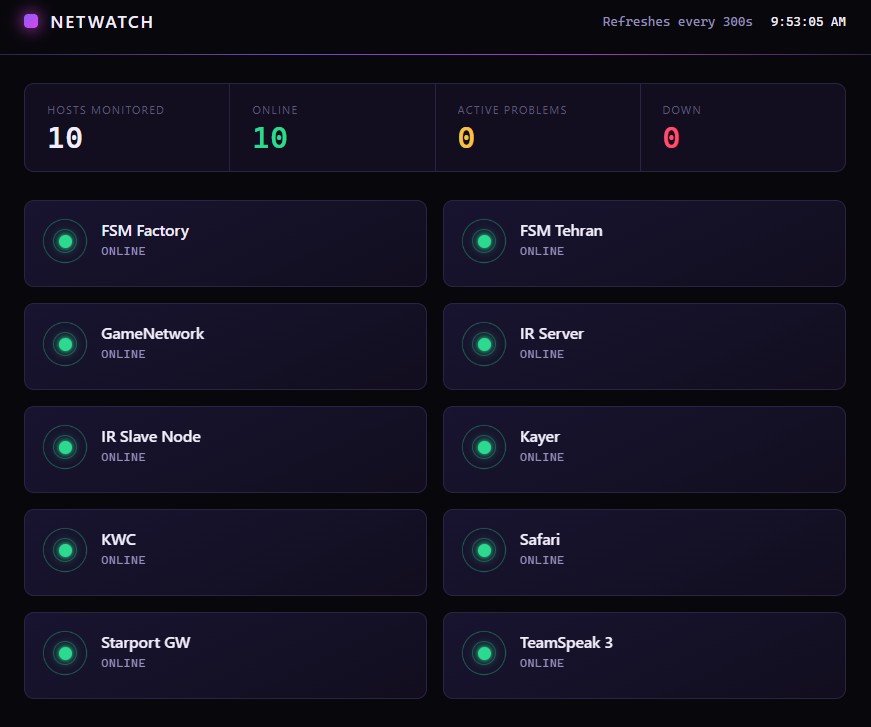
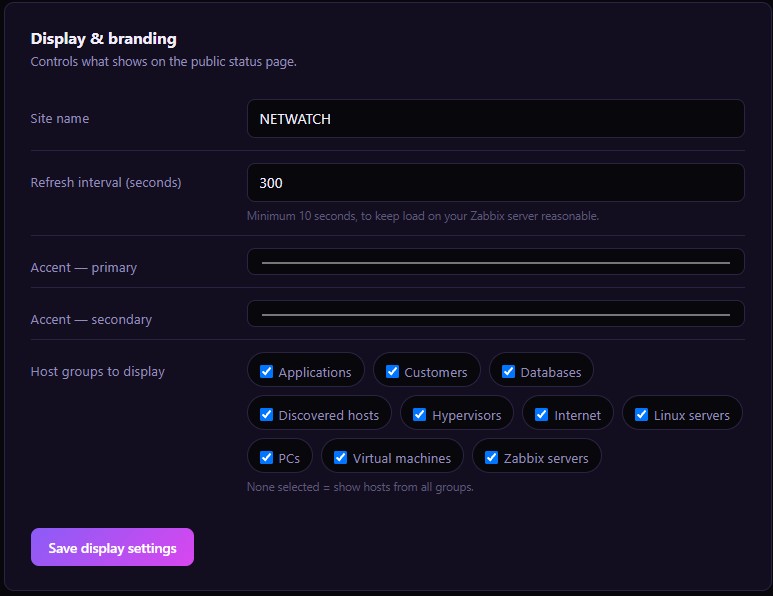
Customizability in NETWATCH is built around the same philosophy as the rest of the project — minimal, intentional, and fully controlled from the UI without editing a single line of code.
You can tailor everything: choose which Zabbix host groups appear on the public dashboard, adjust refresh intervals, switch between compact or spacious layouts, and customize colors to match your brand. The admin panel lets you manage API tokens, tweak display behavior, and control visibility of hosts or groups, all stored securely server‑side. NETWATCH stays lightweight, but gives you full control over how your status page looks, feels, and behaves.
